Introduction
Data analysis is the process of cleaning, transforming, and modeling raw data with the goal of uncovering useful insights and conclusions. In this comprehensive guide, we will explore the importance of data analysis, the different types, and the various techniques and tools used in the analysis process.
What is Data Analysis?
Data analysis refers to the process of examining raw data using analytical and statistical tools to derive insights and conclusions. It involves the use of techniques such as data cleaning, transformation, and modeling to uncover patterns and trends in data.
Importance of Data Analysis
Data analysis plays a crucial role in helping businesses make informed decisions. It provides valuable insights into customer behavior, market trends, and business performance, which can be used to improve products, services, and operations. By leveraging data, businesses can gain a competitive advantage in the market.
Types of Data Analysis
There are several types of analysis of data, including descriptive analysis, exploratory analysis, inferential analysis, and predictive analysis. Each type of analysis is used to achieve specific goals and objectives, such as understanding data patterns, making predictions, or testing hypotheses.
Data Collection
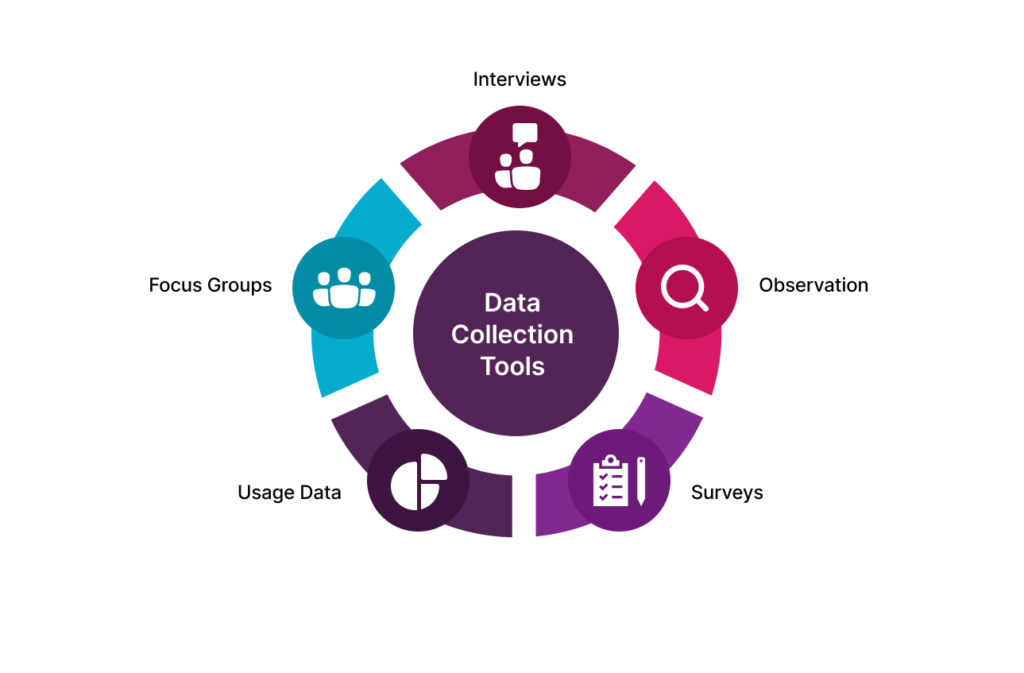
Collecting data is the first step in the data analysis process. It involves the gathering of data from various sources, such as surveys, experiments, or observations.
Methods of Data Collection
There are several methods of data collection, including interviews, questionnaires, observations, and experiments. The choice of data collection method depends on the research question and the type of data being collected.
Sampling Techniques
Sampling techniques are used to select a representative subset of the population for data collection. Common sampling techniques include random sampling, stratified sampling, and cluster sampling.
Data Preprocessing
Preprocessing is the process of cleaning, transforming, and integrating raw data to prepare it for analysis.
Data Cleaning
Cleaning involves identifying and correcting errors, inconsistencies, and missing values in the data.
Data Transformation
This involves converting raw data into a format that is suitable for analysis. Common data transformation techniques include normalization, scaling, and feature engineering.
Data Integration
Integration involves combining data from multiple sources into a single dataset for analysis.
Data Reduction
Data reduction involves reducing the size and complexity of the dataset while retaining the essential information. Common data reduction techniques include feature selection and dimensionality reduction.
Exploratory Data Analysis (EDA)
EDA is used to summarize and visualize the main characteristics of the dataset.
Data Visualization
Data visualization is used to represent data visually using charts, graphs, and other visualizations to identify patterns and trends.
Descriptive Statistics
Descriptive statistics are used to summarize the main characteristics of the dataset, such as the mean, median, and standard deviation.
Data Exploration Techniques
Data exploration techniques are used to gain a deeper understanding of the data, such as correlation analysis, cluster analysis, and principal component analysis.
Statistical Analysis
Statistical analysis involves the use of statistical methods to analyze data and draw conclusions.
Hypothesis Testing
Hypothesis testing is used to test a hypothesis about a population based on a sample of data.
Types of Variables
There are two types of variables: categorical and numerical. Categorical variables are qualitative, while numerical variables are quantitative.
Probability Distributions
Probability distributions are used to describe the probability of different outcomes in a random experiment.
Correlation and Regression Analysis
Correlation analysis is used to measure the strength of the relationship between two variables, while regression analysis is used to model the relationship between two or more variables.
Machine Learning
Introduction to Machine Learning
Machine learning is a subfield of artificial intelligence (AI) that focuses on building systems that can learn from data, identify patterns, and make decisions with minimal human intervention. In other words, it is a way of training computers to learn from experience and improve their performance on a specific task over time. Machine learning is widely used in various industries, including finance, healthcare, retail, and marketing.
Types of Machine Learning
There are three main types of machine learning: supervised learning, unsupervised learning, and reinforcement learning.
Supervised Learning
Supervised learning is a type of machine learning where the model is trained on labeled data. The goal is to learn a mapping between input variables (features) and output variables (labels) so that the model can predict the output for new input data. Supervised learning is commonly used in classification and regression problems.
Unsupervised Learning
Unsupervised learning is a type of machine learning where the model is trained on unlabeled data. The goal is to find patterns and structure in the data without any prior knowledge of what the output should be. Unsupervised learning is commonly used in clustering, anomaly detection, and dimensionality reduction problems.
Reinforcement Learning
Reinforcement learning is a type of machine learning where the model learns by interacting with an environment and receiving feedback in the form of rewards or penalties. The goal is to learn a policy that maximizes the cumulative reward over time. Reinforcement learning is commonly used in robotics, gaming, and control systems.
Data Analysis Tools and Software
Popular Software Tools and their Comparison
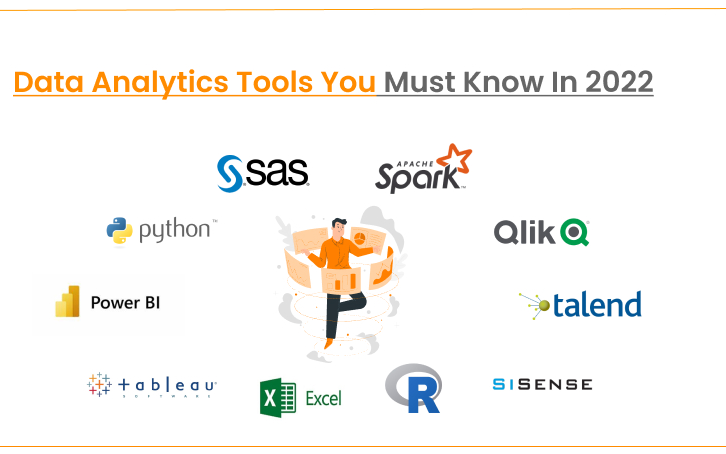
When it comes to data analysis, there are several popular tools and software available in the market. Each tool has its unique features and capabilities, and choosing the right one can be a challenge. Here is a brief comparison of some of the most popular analysis tools:
Microsoft Excel: A widely used spreadsheet program that allows users to perform basic statistical analyses, create graphs and charts, and manipulate data.
Tableau: A powerful data visualization tool that enables users to create interactive dashboards, maps, and charts.
IBM SPSS: A comprehensive statistical software package that provides advanced analytics capabilities, including hypothesis testing and predictive modeling.
Python and R: Open-source programming languages that offer powerful data analysis and machine learning libraries and frameworks.
SAS: A suite of software products designed for advanced data analytics, including data management, statistical analysis, and business intelligence.
MATLAB: A numerical computing environment that enables users to analyze and visualize data, create models and simulations, and develop algorithms.
Apache Hadoop and Apache Spark: Distributed computing frameworks that allow users to process large volumes of data in parallel.
Criteria for Choosing Data Analysis Tools
When choosing a data analysis tool, several factors should be considered, such as the size and complexity of the data, the required level of analysis, and the user’s experience and expertise. Other factors may include cost, ease of use, and compatibility with existing software and hardware.
Data Analysis Process
Overview of the Data Analysis Process
The data analysis process typically involves several stages, including data collection, data preprocessing, exploratory data analysis, statistical analysis, and machine learning. These stages are often iterative and may involve revisiting previous stages as new insights are gained.
Data Analysis Project Life Cycle
The data analysis project life cycle typically includes the following stages:
- Project planning
- Data collection
- Data preprocessing
- Exploratory data analysis
- Statistical analysis
- Machine learning
- Results interpretation and reporting
Best Practices for Data Analysis
To ensure accurate and reliable results, data analysts should follow best practices such as:
- Defining clear research questions
- Ensuring data quality and consistency
- Using appropriate analysis methods
- Documenting the analysis process
- Testing and validating results
- Communicating results effectively
Challenges in Data Analysis
Common Challenges
Data analysis can be a complex and challenging task, and some common challenges include:
- Data quality issues, such as missing data, inconsistencies, and errors
- Handling large and complex data sets
- Choosing the right analysis methods and techniques
- Interpreting and communicating results effectively
- Dealing with unexpected or unanticipated results
Strategies for Overcoming Data Analysis Challenges
To overcome analysis challenges, data analysts can employ several strategies, such as:
- Conducting thorough data quality checks and cleaning
- Using appropriate data preprocessing techniques
- Seeking input and advice from domain experts
- Experimenting with different analysis methods and techniques
- Collaborating with colleagues and peers
Conclusion
Recap of Key Concepts: Data analysis is a critical component of any research or business project, and it involves several stages, including data collection, preprocessing, exploratory data analysis, statistical analysis, and machine learning. Popular analysis tools and software include Microsoft Excel, Tableau, IBM SPSS, Python, R, SAS, MATLAB, Apache Hadoop, and Apache Spark. When choosing a tool, several factors should be considered, including the size and complexity of the data, the required level of analysis, and the user’s experience and expertise.
FAQs
1. What is the most important factor to consider when choosing a data analysis tool?
The most important factor to consider when choosing a data analysis tool is its compatibility with the data you want to analyze.
2. Can I use Excel for data analysis?
Yes, Excel can be used for basic data analysis tasks, but for more advanced analysis, specialized software may be required.
3. How important is data visualization in the data analysis process?
Data visualization is extremely important in the analysis process as it helps to uncover insights and patterns that may be difficult to see in raw data.
4. How can I ensure the accuracy of my analysis results?
To ensure the accuracy of your results, it’s important to use appropriate statistical methods, validate assumptions, and perform sensitivity analyses.
5. What are some common challenges in the analysis process?
Common challenges in the analysis process include data quality issues, data preprocessing difficulties, and selecting appropriate analysis methods.